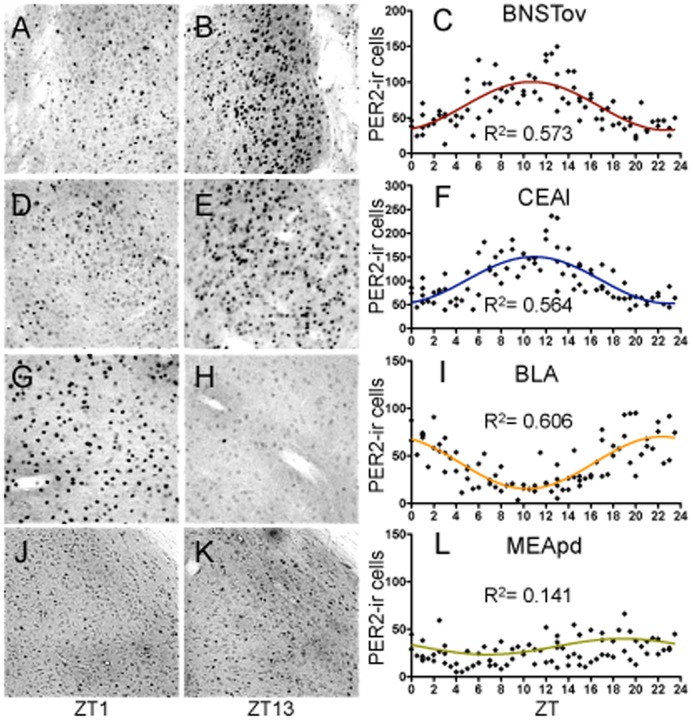
Figure 5. Amygdala and bed nucleus of the stria terminalis.
Representative photomicrographs of PER2-ir cells in the oval nucleus of the BNST (A–B), central amygdala, lateral part (D–E), basolateral amygdala (G–H), and medial amygdala, posterior dorsal part (J–K) at ZT1 and ZT13, scale bar 100 µm. Mean number of PER2-immunoreactive cells in the BNSTov (C), CEAl (F), BLA (I), and MEApd (L) of each individual rat (diamonds) across 48 zeitgeber times fitted with a 24-h sine wave. R2 = Goodness of fit value for given region. n = 84 for all regions.

