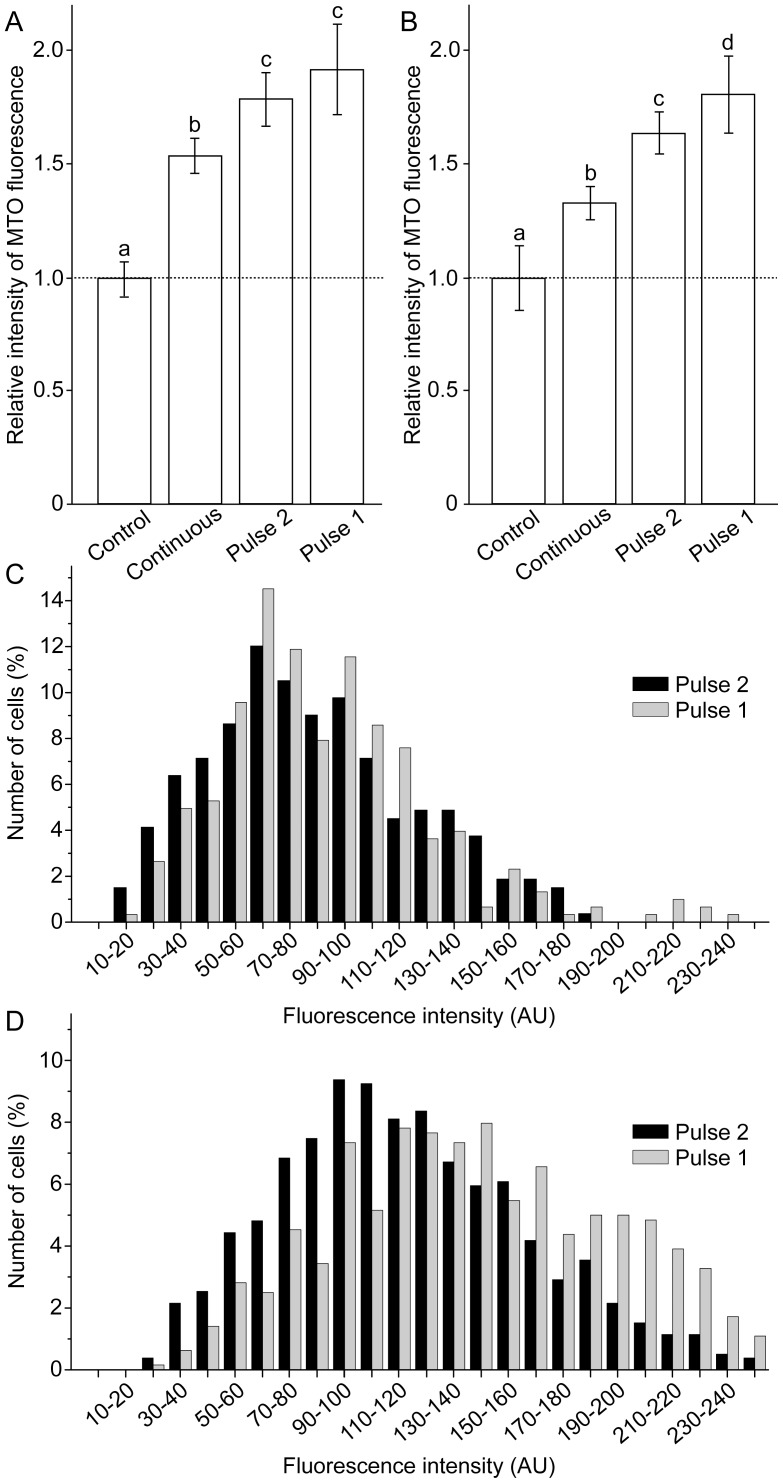
Figure 3. Relative intensity and percentage distribution of MTO fluorescence.
(A) Relative intensity of MTO fluorescence in astrocytes. (B) Relative intensity of MTO fluorescence in C6 cells. Bars not sharing a common letter are significantly different (P<0.05). (C) Percentage distribution of astrocytes according to average per-pixel intensities of MTO fluorescence. (D) Percentage distribution of C6 cells according to average per-pixel intensities of MTO fluorescence. The number of cells (%) was bracketed to 10 AU steps, covering the whole range of fluorescence intensities (0–255 AU). Treatment regimes are illustrated in Figure 2.

