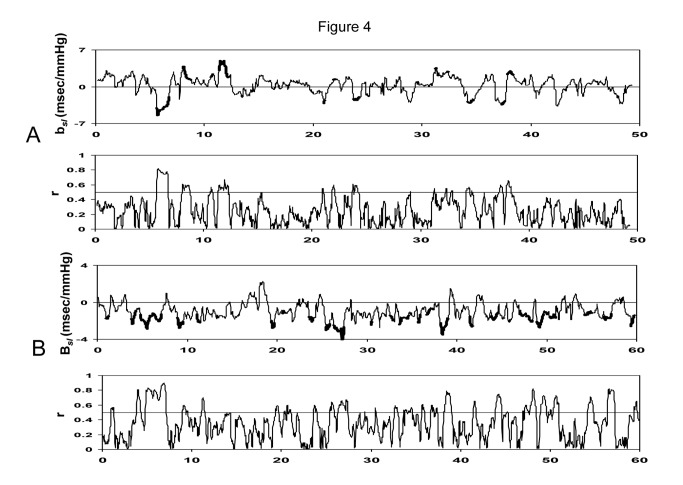
Figure 4. Representative tracings of b sl (the slope of 1 min IBI-SBP regression line assessed by 1 min sliding window method), and r-the correlation coefficient as a function of time during the whole session of the recording in a control (upper panels, A) individual and in a transplanted patient (lower panels, B).
The bold portions of bsl tracings represent epochs with a correlation coefficient (r) between IBI and SBP greater than 0.5. In the control patient’s tracing, 55% of episodes in such epochs were baroreflex with a positive b sl, while the remaining 45% were non-baroreflex with a negative b sl. A similar tracing for a transplanted patient is shown in Figure 4, lower panel. In this patient, all sequences (100%) were nonbaroreflex episodes.

