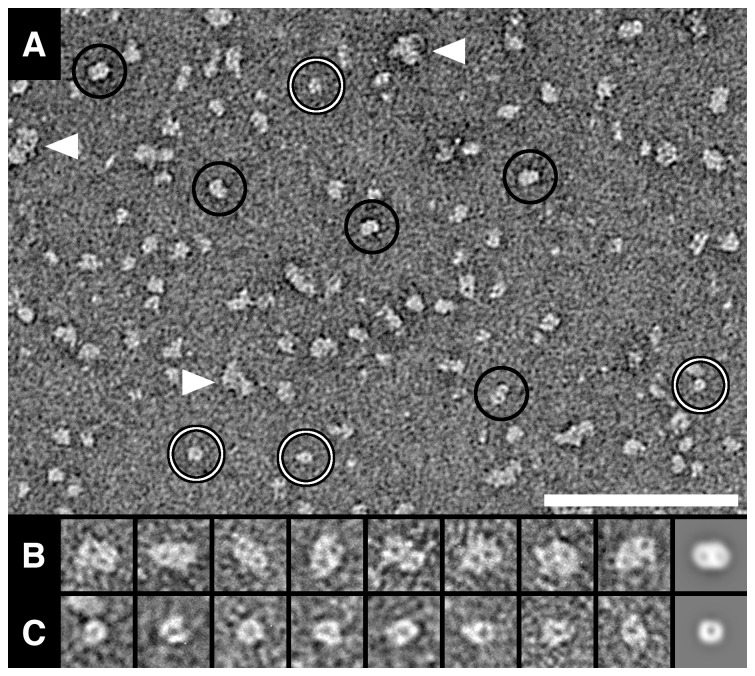
Figure 3. Negative stain-TEM and SPA of purified hSVCT1.
(A) Overview electron micrograph of purified hSVCT1 adsorbed on a parlodion carbon-coated surface. Projections of differently oriented hSVCT1 proteins are discerned. Large, elliptical (hSVCT1 dimers) and small, round-shaped (hSVCT1 monomers) particles are marked by black and white circles, respectively. Small protein aggregates are also observed (arrowheads). Well-preserved top views of dimers (B) and monomers (C) were magnified and are displayed in the gallery. The rightmost frames in (B) and (C) display averages of dimer (n = 387) and monomer (n = 316) top views, respectively. In hSVCT1 dimers (B) two stain accumulations are discerned, while in monomers (C) only one. Averages are low-pass filtered to 2 nm resolution. The scale bar in (A) is 100 nm. The frame sizes in (B) and (C) are 18.5 nm.

