
Figure 3. Expression of both CCL22 and Foxp3 +Tregs infiltration in the tumor bed was associated with BC prognosis.
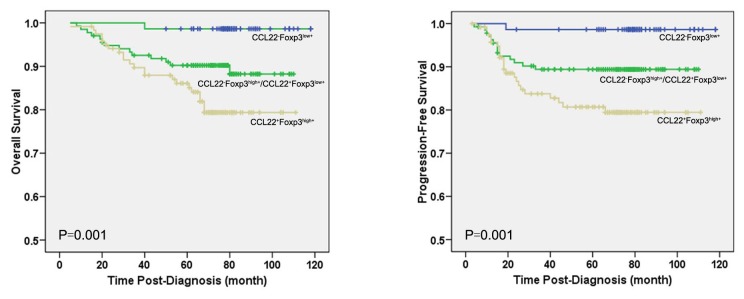
Kaplan-Meier curves are shown for overall survival (OS) (A) and progression-free survival (PFS) (B) was stratified by expressions of two factors to divide the patients into three subsets, CCL22-Foxp3low+ group, CCL22-Foxp3high+/CCL22+Foxp3low+ group, and CCL22+Foxp3high+ group. The CCL22+Foxp3high+ group was associated with both shorter OS (P=0.001) and PFS (P=0.001) than CCL22-Foxp3high+/CCL22+Foxp3low+ group, and CCL22-Foxp3low+ group.