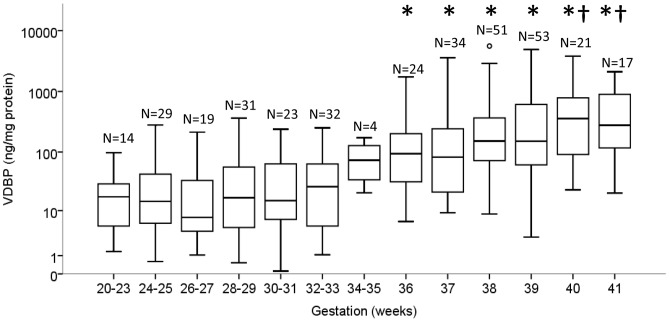
Figure 3. The VDBP concentration in the CVF significantly increased with advancing gestational age.
The * indicates significance in the VDBP concentration in gestational groups ≤30–31 weeks' compared with CVF samples collected ≥36 weeks' gestation. The † indicates significance in VDBP concentration between samples collected at 36 and 37 weeks' gestation compared with samples collected at 40 and 41 weeks' gestation. Statistical significance was defined as P<0.05 (2-way ANOVA). The box and whisker plots represent the median and interquartile range with the 5th and 95th centile range. Outliers are represented by open circles.

