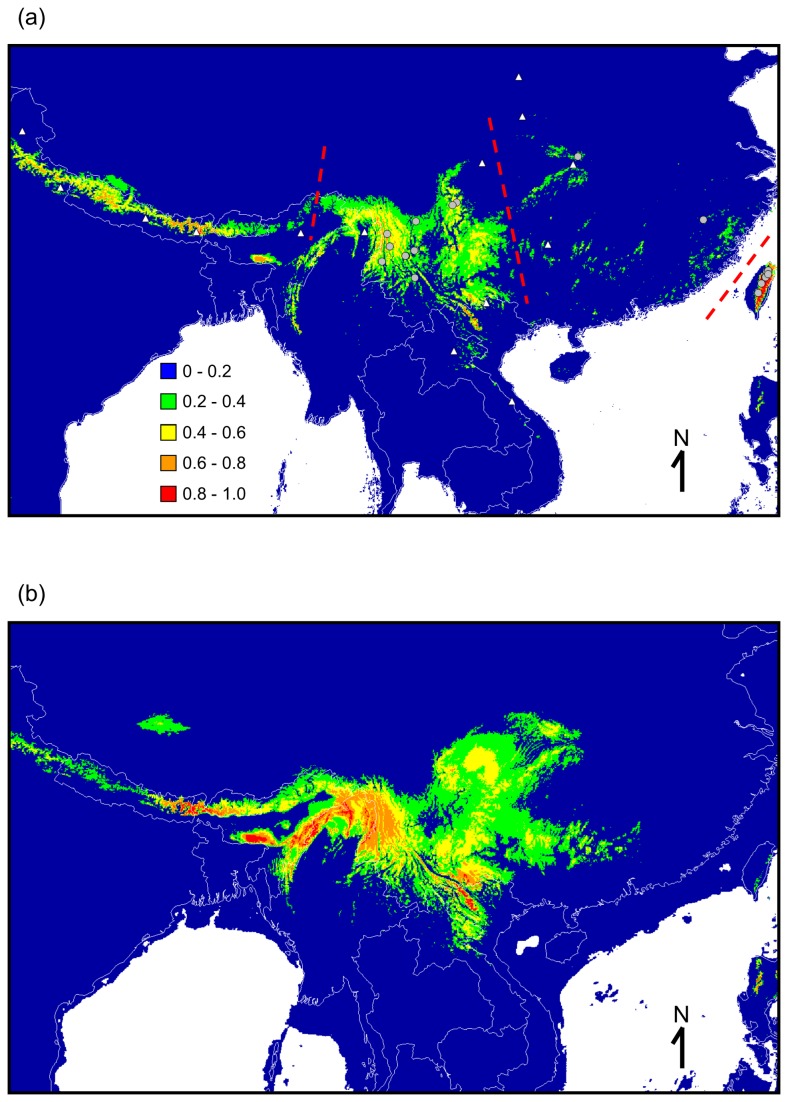
Figure 1. Predicted suitable Chimarrogale himalayica habitat based on current (a) and (b) historical climatic conditions.
The colors indicate the probability of a habitat being suitable. White indicates areas without climate data. Red dashed lines indicate boundaries for the distributions of the three subspecies of Chimarrogale himalayica. Gray circles indicate the localities used to construct the model. White triangles indicate distribution localities summarized by Corbet and Hill [3].

