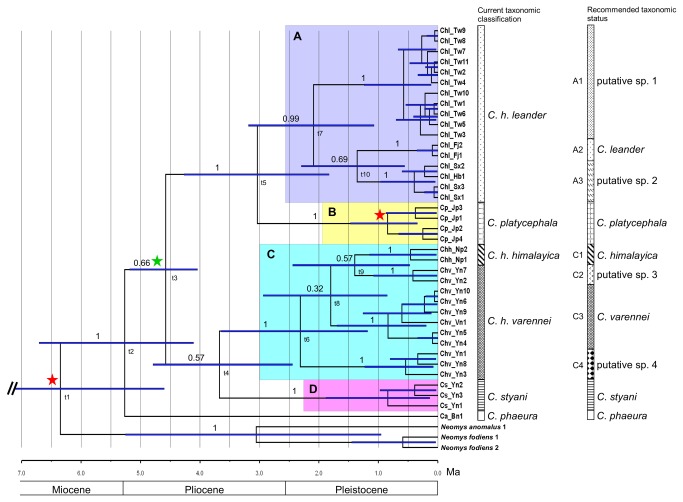
Figure 3. Bayesian phylogenetic results, with divergence time estimations.
This is a fossil-calibrated chronogram of a Bayesian phylogenetic analysis, which was constructed from mitochondrial DNA cytochrome b sequences, with a relaxed molecular clock. Branch length indicates the time of divergence. Node bars indicate the 95% credible interval for node ages. Numbers above branches indicate the posterior probabilities supporting each node. Letters below the branch nodes indicate the node numbers correlated with Table 4. The four main clades are shaded with different colors (clades A to D). Red stars indicate fossil-calibrated nodes. The green star indicates the calibration for Chimarrogale living in China. Correlated Epochs and ages are shown. Current and recommended taxonomic statuses are also shown.

