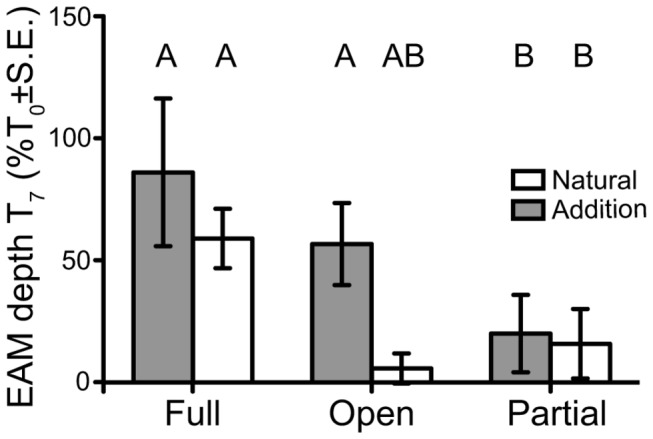
Figure 2. EAM turf lengths at T7 (3 months post sediment addition).

Filled bars represent sediment addition treatments and open bars natural sediment treatments. A and B denote significant groupings (Fisher’s LSD). Data are shown as percentage of T0 ± standard error, sites are pooled, therefore n = 6 replicates for each.
