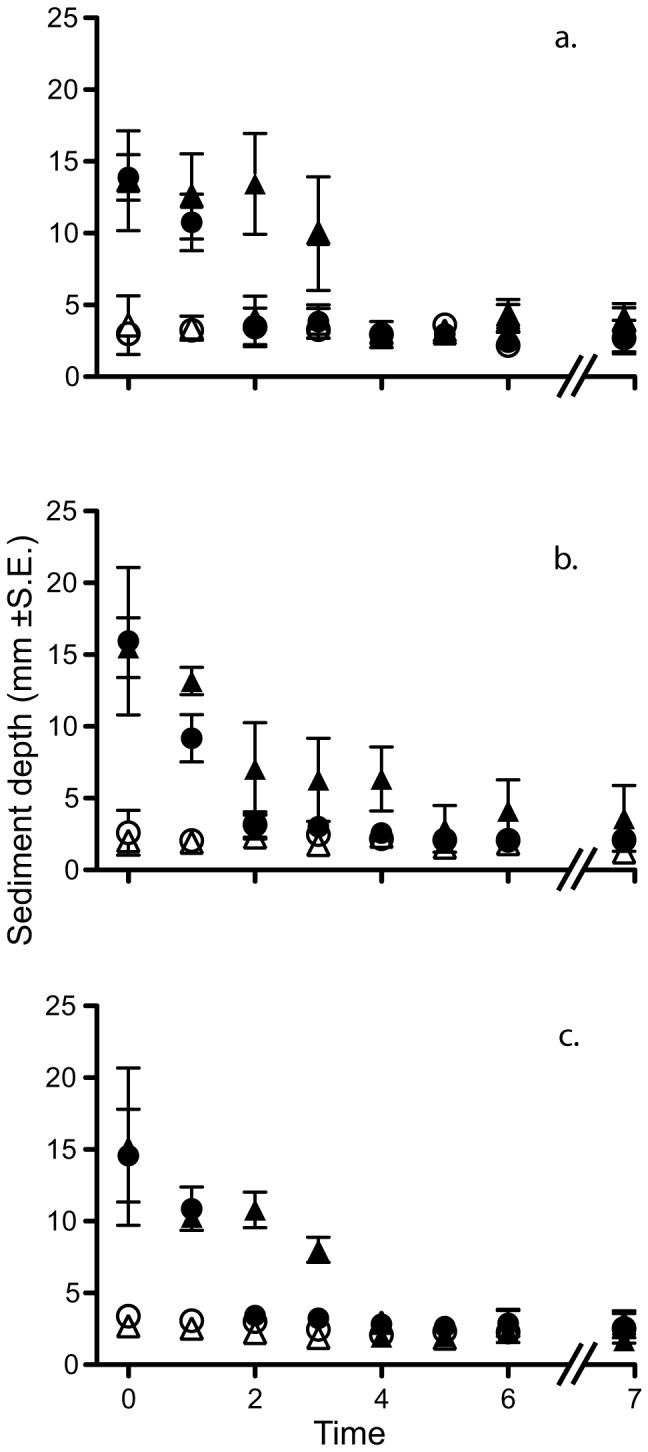
Figure 4. Sediment depth over time.

Filled points represent sediment addition treatments, open points represent natural sediment treatments. Circles represent data from site 1, and triangles site 2. Time is measured in weeks except T7, which is three months after T0. a. shows data from the caged plots, b. the open plots, and c. the partially caged plots. Data are shown as mean depth in mm ± standard error, n = 3 replicates for each.
