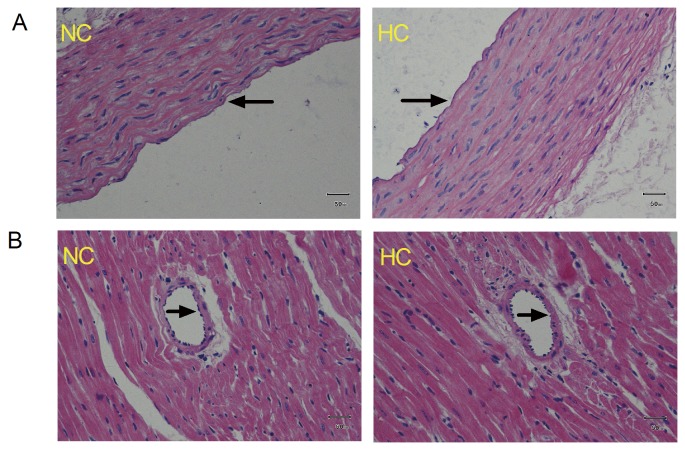
Figure 1. Representative cross-sections of the thoracic aorta (A) and the left myocardial branch of the coronary artery (B) from normocholesterolemic (NC) and hypercholesterolemic (HC) rats (fed 2% cholesterol-enriched chow for 8 weeks) by hematoxylin-eosin (HE) staining (400×).
The arterial lumen is indicated by the arrow, n = 5 hearts/group.

