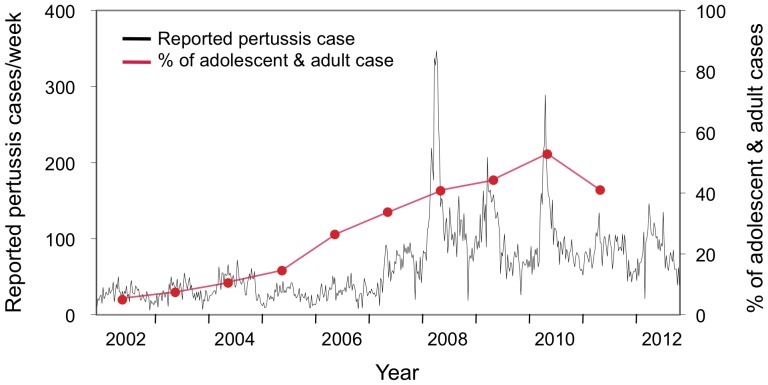
Figure 1. Number of reported pertussis cases per week in Japan from 2002 to 2012.
Pertussis cases are shown by the black line, with each value representing a week of the year. The percentage of adolescent and adult cases (≥15 years old) per year is shown in red circles. The data were obtained from the Ministry of Health, Labor and Welfare of Japan Infectious Disease Surveillance data. Data regarding the number of adolescent and adult cases in 2012 were not available.

