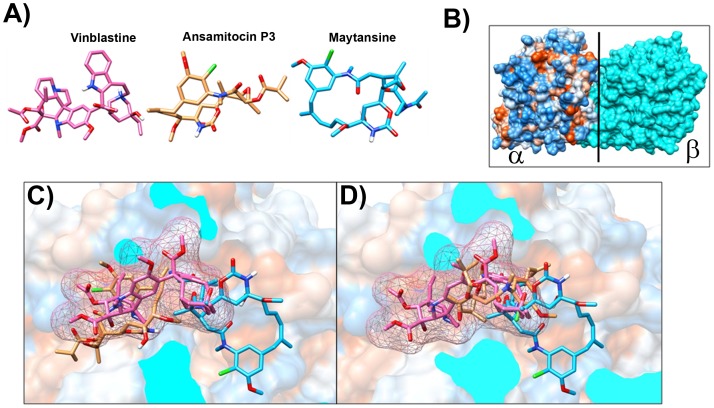
Figure 9. Ansamitocin and maytansine bind at the vinblastine binding pocket in tubulin dimer.
(A) Structures of vinblastine (Pink), ansamitocin P3 (brown) and maytansine (blue) are shown. (B) Surface view of α-β tubulin dimer, α chain is shown in hydrophobic surface while β chain is shown in cyan color. Vertical black line shows the axis where the β chain is sliced out to show the cross-sectional views in (C) and (D). (C) and (D) show the cross-sectional view of the vinblastine binding site. The two binding orientations, position A and position B, of ansamitocin P3 (brown sticks) are shown in (C) and (D), respectively. Vinblastine is depicted with pink sticks and mesh surface and maytansine is shown in blue sticks. Ansamitocin P3, in position A, is partially overlapping with vinblastine binding pocket while ansamitocin P3, in position B, is partially overlapping with vinblastine binding pocket and partially with maytansine binding pocket. Interestingly, maytansine binding site also partially overlaps with vinblastine binding pocket.

