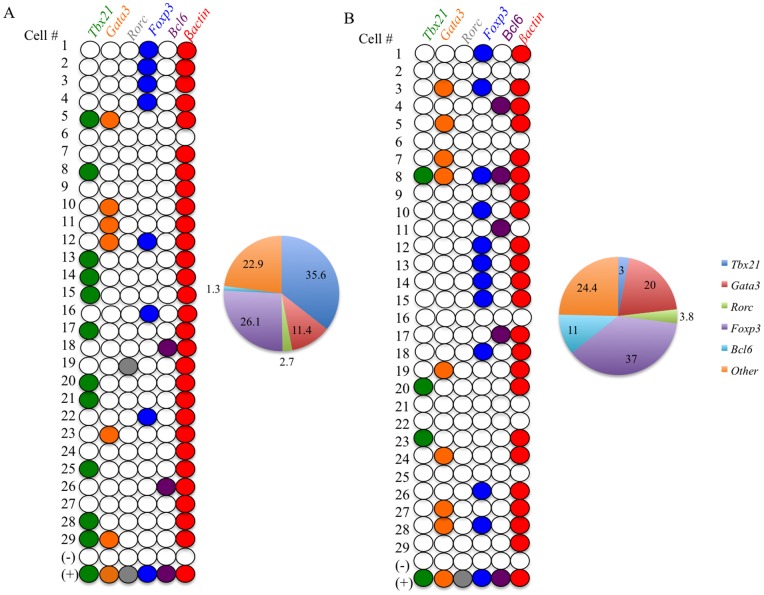
Figure 4. Applications of the assay.
CMV specific CD4 T cells were single cell sorted and used for the scRT-PCR assay. Expression of the 5 TF and ß-actin was detected using real-time PCR. The numbers on the left hand side represent the cell numbers, with positive (activated CD4 T cell RNA) and negative (no cell) controls. 29 individual cells are represented here from the total of 62 cells. Colored circles represent the presence of the TF within the cell. A) CMV specific single cells (representative result of 3 experiments performed on each of 4 individuals) TF profile with Pie chart. B) TT specific single cells (representative result of 3 experiments performed on each of 2 individuals). (+) represents the positive RNA control extracted from activated CD4 T cells, (−) represents the no cell negative control. Cells that do not express ß-actin are excluded.

