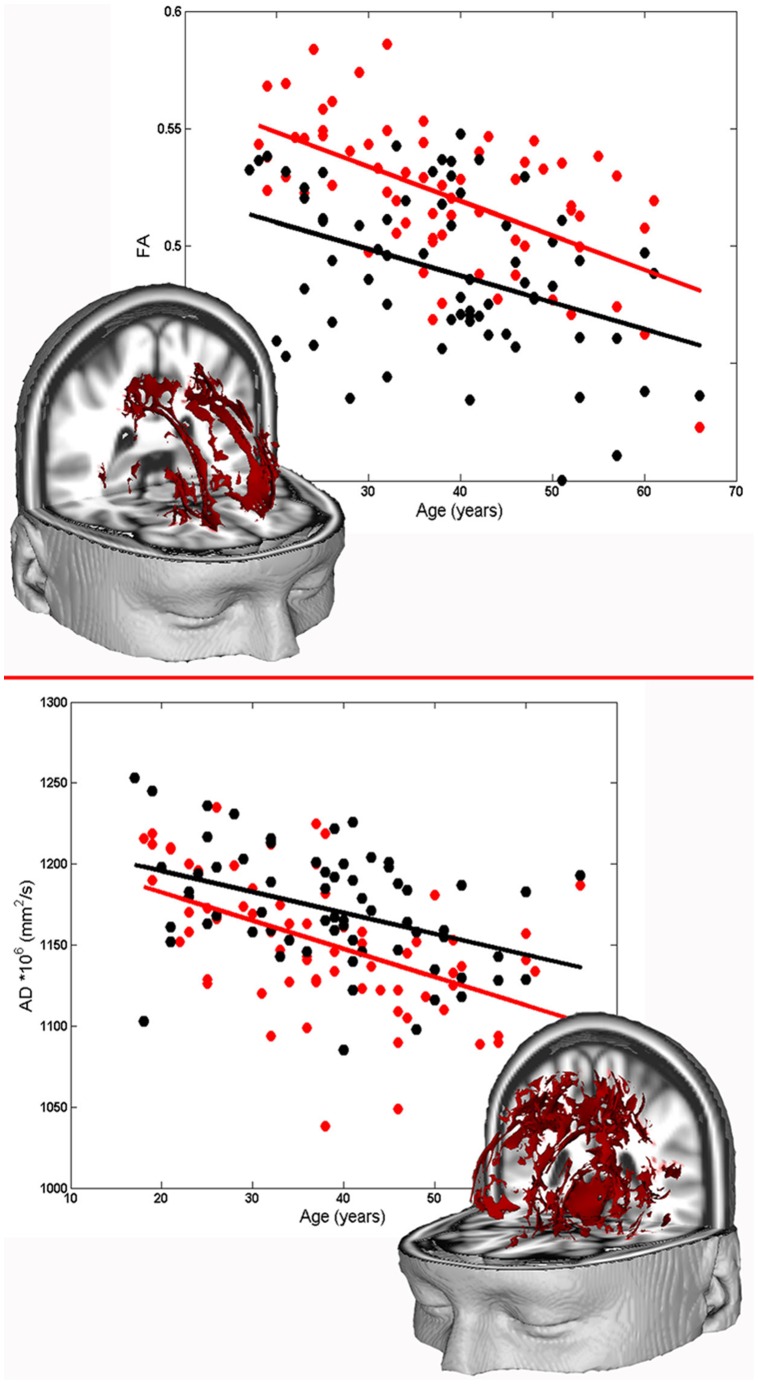
Figure 1. Age-related trajectories of WM DTI parameters of SZ and HC subjects.
Upper part: three-dimensional representation of clusters in which a main effect of group characterizes the relationship between FA and age. The scatter plot shows the mean FA value in these clusters as a function of age for SZ (white circles) and HC (red circles). Solid lines represent the linear fits for each group. Lower part: three-dimensional representation of clusters where a significant correlation between AD and age results in both SZ and HC groups. The plot shows the mean AD value in these clusters as a function of age for SZ (white circles) and HC (red circles). Solid lines represent the linear fits for each group.

