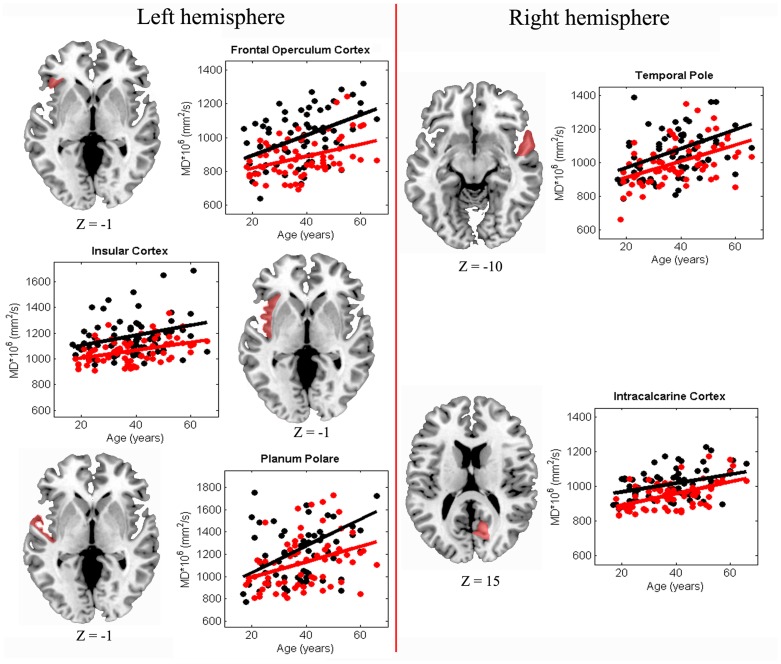
Figure 2. Age-related trajectories of MD within cortical GM of SZ and HC subjects.
Scatter plot of MD (* 106 cm2/s) as a function of age for SZ (white circles) and HC (red circles). Solid lines represent linear fits for each group. Representative axial slices of the brain are reported for each hemisphere. Cortical regions in which the aging path followed by MD is different in SZ and HC are marked in red. Z coordinates are indicated in MNI space.

