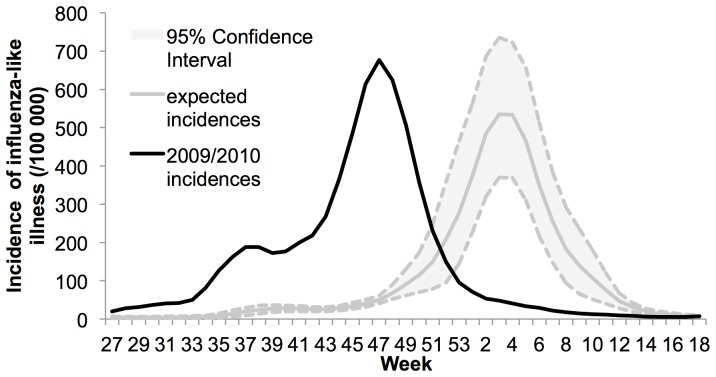
Figure 1. Incidences of influenza-like illness in 2009–2010 for France.
Observed incidences are shown with black lines while expected incidences are shown with gray lines along their 95% confidence interval in dashed lines. Expected incidence is based on 2004–2009 data. The comparison shows the pandemic arrived sooner than previous years. The plot show smoothed data.

