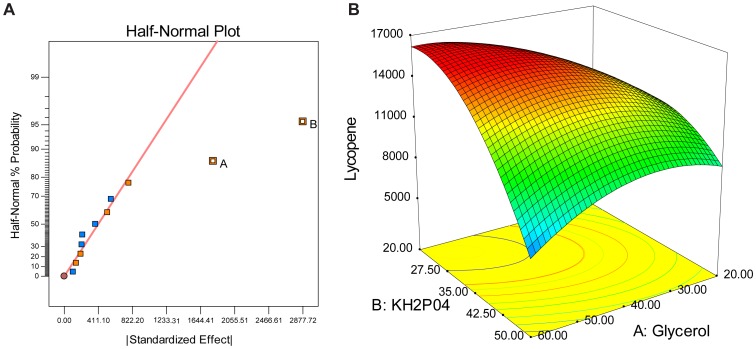
Figure 3. Identification and optimization of critical media composition for the production of lycopene in PTS01 strain.
(A) Half-normal probability plot of the results of minimal resolution IV experiment design (The details of the experiment design were shown in Table S1 in File S1). In the half-normal probability plot, the line was called the near zero line. The estimated effect of an unimportant factor will typically be on or close to a near-zero line, while the estimated effect of an important factor will typically be displaced well off the line. (B) RSM plot of lycopene production versus concentrations of glycerol and KH2PO4 of PTS01.

