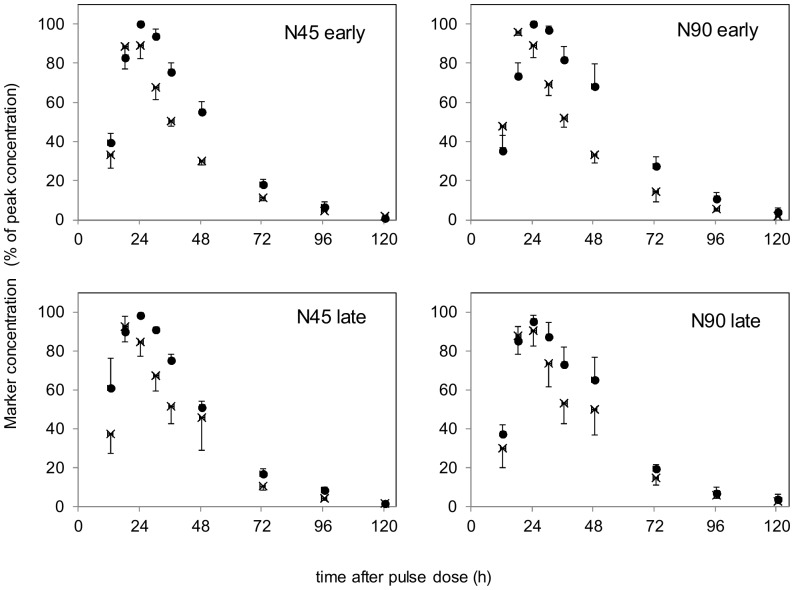
Figure 2. Fecal dilution curves of δ13C labeled C31 n-alkane (•) and chromium mordanted fiber (×).
Dilution curves show mean fecal tracer concentrations with standard error bars upon an intraruminal pulse dose in dairy cows fed grass silages of early and late maturity at two nitrogen (N) fertilization levels (N45∶45 kg N/ha; N90∶90 kg N/ha).

