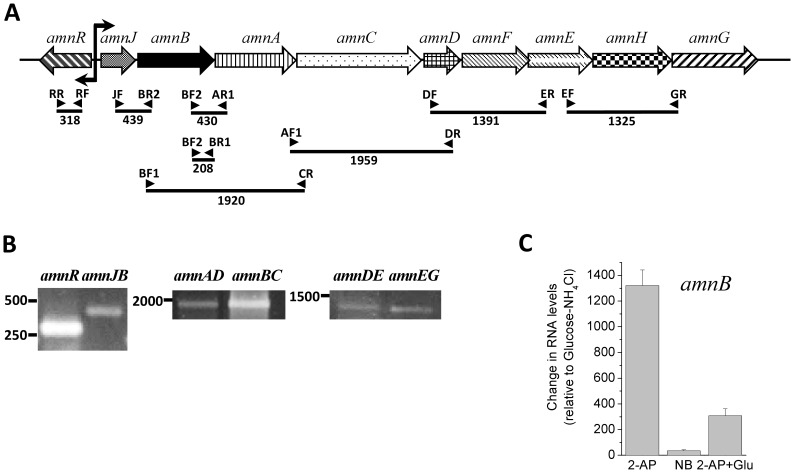
Figure 4. Transcriptional analysis of the amn genes.
A, Organization of the amn genes and schematic representation of the location and size of the amplicons obtained by RT-PCR experiments. Predicted promoters are shown as break arrows, bent in the directions of transcription. Primers are represented by arrowheads. B, PCR products from RT-PCR experiments using as templates mRNA obtained from LB400 cells collected at early exponential growth phase in liquid BLKN minimal medium with glucose (10 mM) and 2-AP (1 mM) as sole carbon and nitrogen source, respectively. The primer pairs used are listed in Table 1. The amplification products are amnR (318 bp), amnJB (439 bp), amnACD (1959 bp), amnBAC (1920 bp), amnDFE (1391 bp) and amnEHG (1325 bp). C, Transcriptional analysis of the amnB gene. RT-qPCR assays were performed using mRNA from LB400 cells grown in BLKN minimal medium supplemented with glucose (10 mM) and NH4Cl (1 mM) until exponential phase (turbidity at 600 nm of 0.5) and further incubated for 1 h in BLKN medium in presence of glucose (10 mM) and NH4Cl (1 mM), 2-aminophenol (1 mM) (2-AP), nitrobenzene (1 mM) (NB) or glucose (10 mM) and 2-AP (1 mM) (Glu+2-AP). The primer pairs used are listed in Table 1. The ftsZ gene was used as a reference gene.

