
Figure 3.
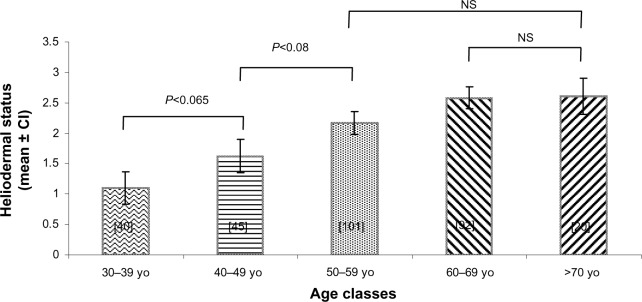
Heliodermal status grade (mean ± confidence interval) in each age cluster. All bars are significantly different from the other, with an exception being the comparison marked on the graph. The number of people in each cluster is indicated between the brackets.
Abbreviations: yo, years, CI, confidence interval; NS, non significant.