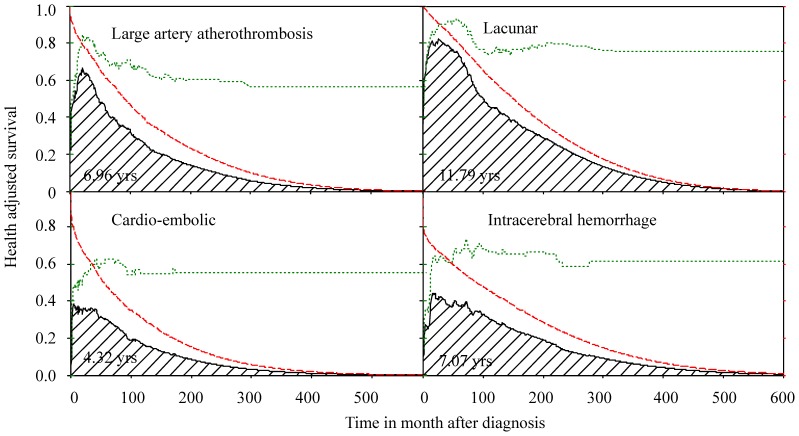
Figure 3. The lifetime health-adjusted survival of stroke patients.
The survival probability (longdash line) multiplied by the proportion of patients with no disability (dotted line) over time after diagnosis results in the health-adjusted survival curve (solid line), which can be summed to estimate the expected life years without functional disabilities for stroke patients (shaded area).

