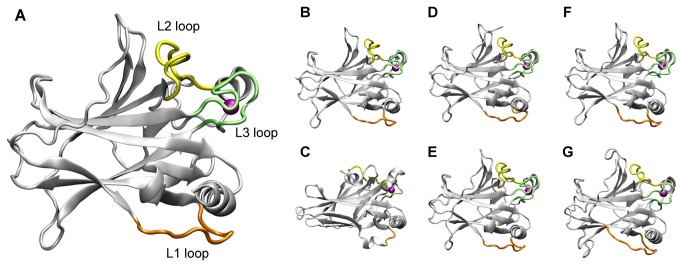
Figure 1. Ribbon representation of the 3D structures used for the bioinformatics analysis and MD simulations.

Ribbon representation of the crystal structures of p53_human (A), p53_mouse (B) and p53_worm (C) and of the model structures of p63_human (D), p73_human (E), p53_chicken (F) and p53_fly (G). L1, L2 and L3 loops are highlighted in orange, yellow and lime, respectively. The zinc ion is represented as a purple sphere.
