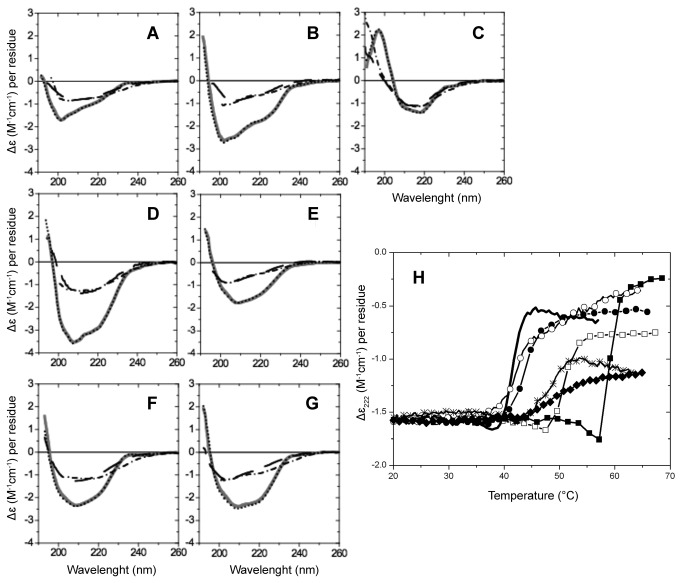
Figure 2. Far-UV CD spectra of p53 family of proteins (A-G) and CD thermal melting curves (H).
CD spectra of (A) p53_human (res. 94-312), (B) p53_mouse (res. 91-308), (C) p53_worm (res. 220-420), (D) p53_fly (res. 78-277), (E) p53_chicken (res. 87-278), (F) p63_human (res. 114-326), (G) p73_human (res. 104-333). Recorded at (-) 20°C, (····) 4°C, (-·-·-) 90°C, and at (----) 20°C after heating. (H) CD thermal melting curves of (-) p53_human, (-●-) p53_mouse, (-∨-) p53_worm, (-○-) p53_fly, (-♦-) p53_chicken, (-■-) p63_human, (-□-) p73_human.

