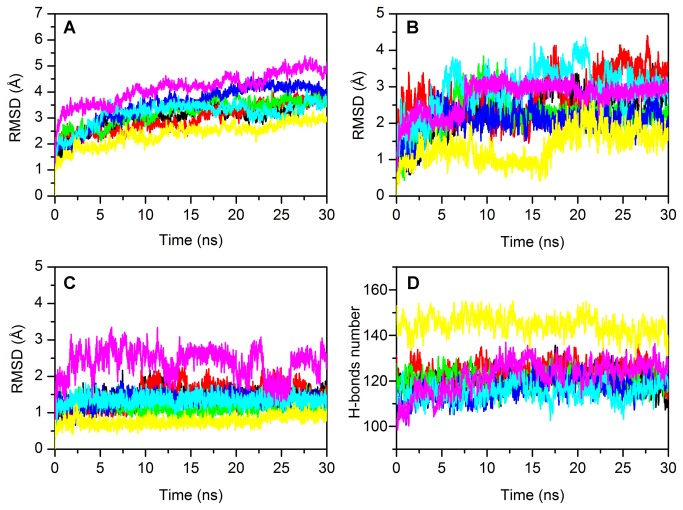
Figure 5. Cα atoms RMSD of the investigated proteins (A), loops 1 (B) and 3 (C) and number of intramolecular H-bonds of the proteins (D).
Cα RMSD of (A) the proteins, of (B) L1 loop, (C) L3 loop and (D) number of intramolecular H-bonds of p53_human (black line), p63 (red line) and p73 (green line), p53_mouse (blue line), p53_chicken (cyan line), p53_fly (purple line) and p53_worm (yellow line), computed from the starting structures as a function of the simulation time.

