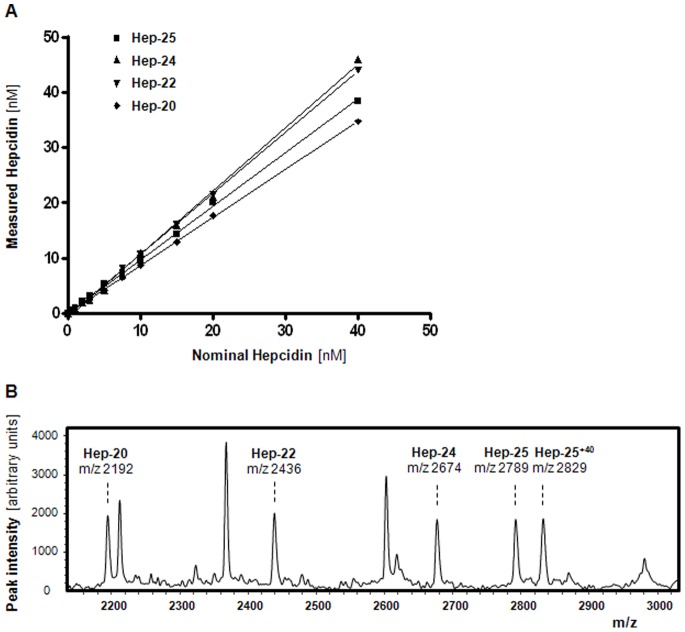
Figure 2. Quantification of hepcidin isoforms using hepcidin-25+40 as internal standard.
A. Linearity (range 0–40 nM) for hepcidin-25, hepcidin-24, hepcidin-22, and hepcidin-20 as determined by hepcidin-25+40 as internal standard. Linearity curves are assessed in different runs. Blank serum (hep-24, hep-20 and hep-25) or heparin plasma (used for hep-22 as serum yields an interfering peak near the position of this isoform) was used as matrix for the addition of the synthetic hepcidin isoforms (PI) to end concentrations of 0, 0.5,1, 2, 3, 5, 7.5, 10, 15, 20 and 40 nM. Since there is a small interfering peak at 2191.8 Da in blank serum, the linearity curve of hepcidin-20 was corrected for the base line hepcidin-20 peak (data not shown). Description of the lines: hepcidin-25, Y = 0.964X+0.064 (R2 = 0.9950); hepcidin-24, Y = 1.145X−0.767 (R2 = 0.9975); hepcidin-22, Y = 1.100X−0.197 (R2 = 0.9998); hepcidin-20, Y = 0.867X+0.055 (R2 = 0.9998). B. WCX-TOF MS profile of blank plasma that was spiked with 10 nM of each of the synthetic hepcidin-20, -22, -24, -25, and -25+40 peptides, which illustrates that all these hepcidin analogues have the same WCX-binding characteristics and flight behavior during TOF MS.

