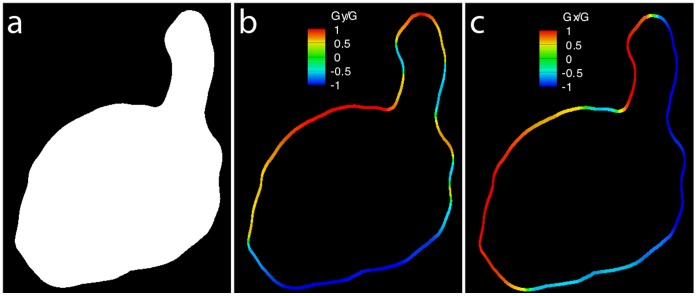
Figure 2. The local signal-to-noise ratio can be used to define the boundary, allowing calculation of the slope of the wall.
(a) Binary mask created by thresholding the SNR map. Colourmap of the slope at the wall in (b) the horizontal direction and (c) the vertical direction after the heart wall identification process.

