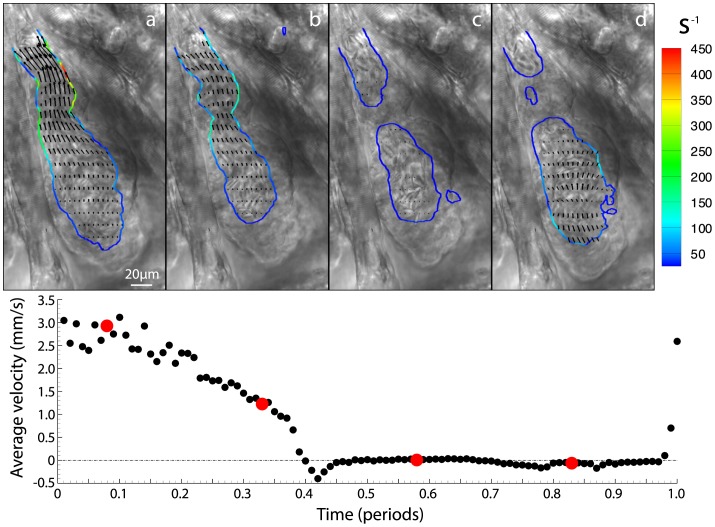
Figure 4. Brightfield images of four equally spaced time points within the cardiac cycle with contours of wall shear (s −1) and vectors of velocity overlaid (Movie S1 provides all 100 times points in the cardiac cycle).
For clarity only every second vector is shown in the horizontal direction and every fifth in the vertical direction. Average velocity through the ventricular-bulbar valve is shown below the brightfield images, with red circles indicating the time points corresponding to points (a) – (d).

