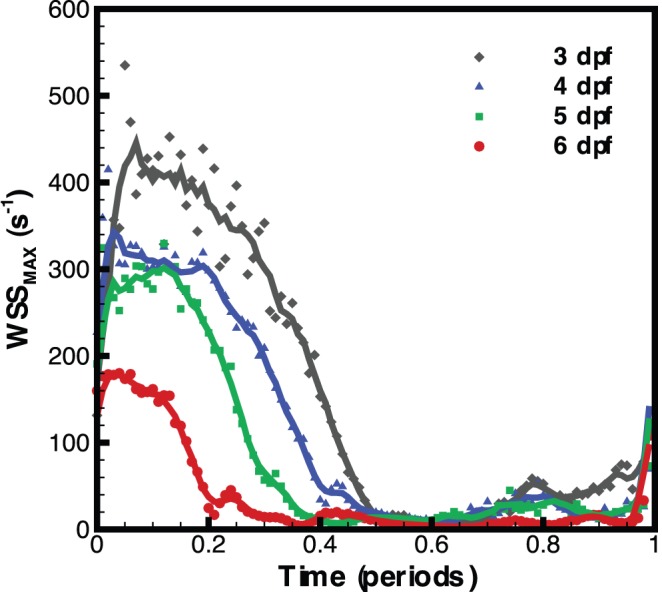
Figure 5. Maximum wall shear rate through the ventricular bulbar valve for each age group, investigated over the entire cardiac cycle.

Symbols represent the average for each age group while lines represent a moving average of the data (5 time points).
