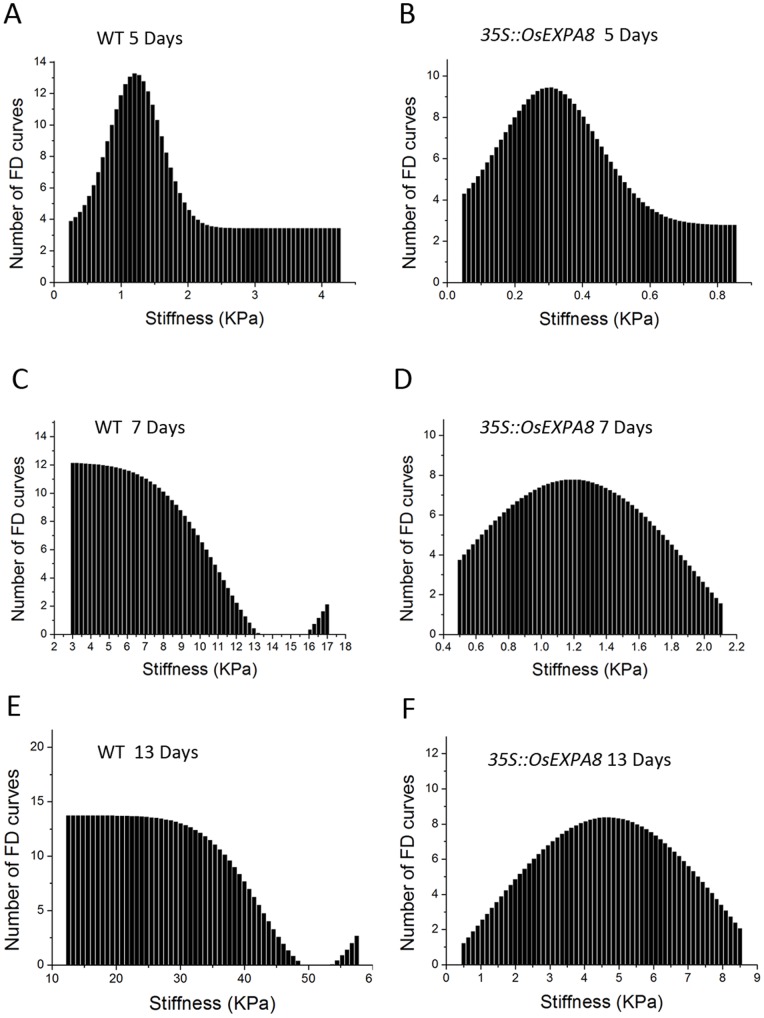
Figure 8. Cell wall stiffness profiles of wild-type and 35S::OsEXPA8 suspension cells with the passage of time in culture.
(A) and (B) on day 5, (C) and (D) on day 10, (E) and (F) on day 13. Each graph corresponds to stiffness values of 150 FD curves obtained on 30 cells, which derived from three biological replications from 35S::OsEXPA8 transgenic line 1. WT: wild-type.

