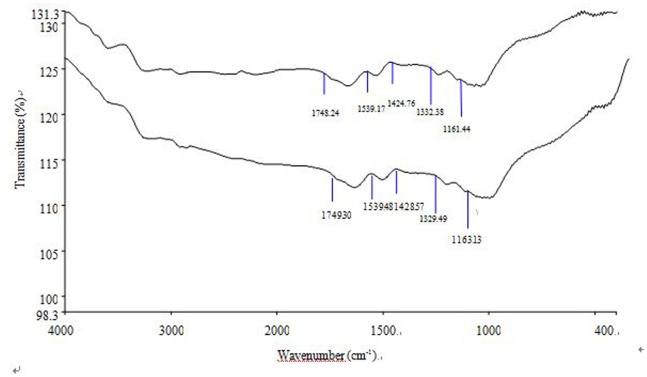
Figure 9. Behavior of infrared absorption bands in cell wall isolates.
Cell wall isolates of wild-type and 35S::OsEXPA8 transgenic line 1 suspension cells on day 10 was used for wall composition analysis. Average and area-normalized Fourier-transform infrared (FTIR) spectra of isolated cell walls from wild-type (lower) and 35S::OsEXPA8 (upper) line 1 suspension cells.

