
Figure 6. ERG and LEF1 induces EMT and are dys-regulated in prostate cancer.
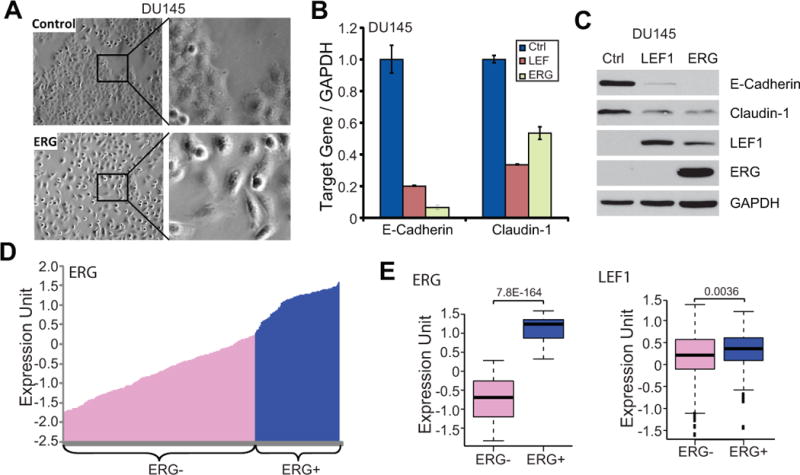
A. ERG overexpression induces EMT of prostate epithelial cells. Phase-contrast microscopy images of stable control and ERG-expressing DU145 cells are shown. ERG-expressing cells lost cell-to-cell contact and showed a spindle-like shape.
B. The expression of epithelial marksis decreased by ERG and LEF1. QRT-PCR analysis of E-cadherin and Claudin-1 were carried out in control and DU145 cells with ERG and LEF1 overexpression.
C. ERG and LEF1 inhibit the expression of epithelial marks. Stable control, ERG-expressing, and LEF1-expressing DU145 cells were analyzed by western blot.
D. Categorization of ERG- and ERG+ prostate cancer specimens. A total of 472 primary prostate cancer tissues were separated into ERG- and ERG+ groups based on the expression level of ERG gene (52).
E. LEF1 is significantly up-regulated in the ERG+ prostate cancers. Boxplot analysis shows the expression level of ERG and LEF1 in the ERG- and ERG+ prostate cancer specimens.