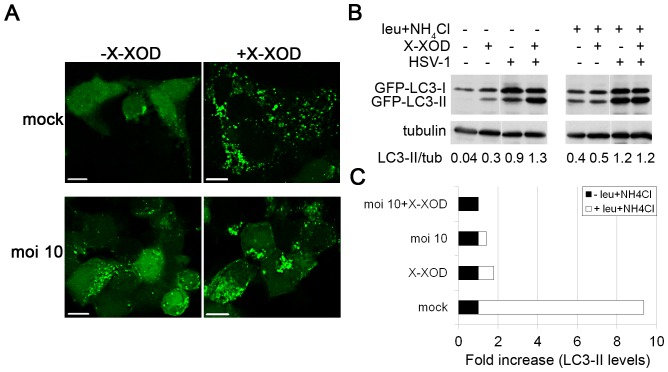
Figure 3. Effects of oxidative stress on autophagy.
A) SK-LC3 cells were simultaneously treated with X-XOD and infected with HSV-1 at a moi of 10 for 18 h and the cellular distribution of GFP-LC3 assessed by fluorescence microscopy. Scale bar: 10 µm. B) Analysis of GFP-LC3 levels by Western blotting with an anti-GFP antibody in SK-LC3 cells simultaneously treated with X-XOD and infected with HSV-1 (moi of 10 for 18 h). The effects of the lysosomal inhibitors leupeptin and ammonium chloride are shown. Blots are representative of four independent experiments; a tubulin blot was performed as a loading control. The ratio of LC3-II to tubulin is shown below the blots. C) The graph represents the fold increase in GFP-LC3-II levels, normalized by tubulin, in leupeptin/NH4Cl-treated cells compared to non-treated cells in all conditions assayed in (B).

