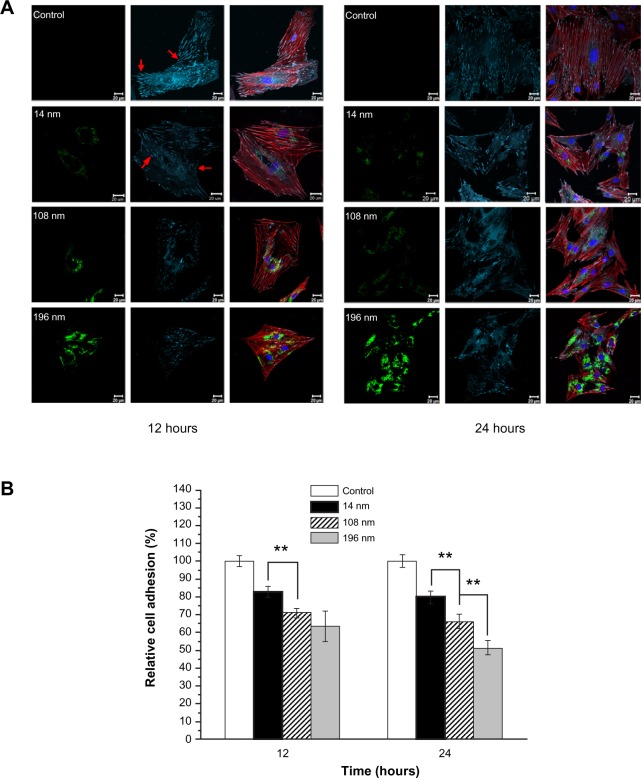
Figure 4.
(A) Confocal microscopic images of mesenchymal stem cells incubated without (control) or with FITC-TiO2 particles (0.10 mg/mL) for 12 and 24 hours, respectively. FITC-TiO2 particles (green), vinculin (cyan), actin filaments (red), and cell nuclei (blue). Scale bar = 20 μm. (B) Relative fluorescence intensity analysis of vinculin. Average fluorescence intensity per cell was normalized to the control sample.
Notes: Error bars represent the mean ± standard deviation for n = 50, **P < 0.01.
Abbreviation: FITC, fluorescein isothiocyanate.

