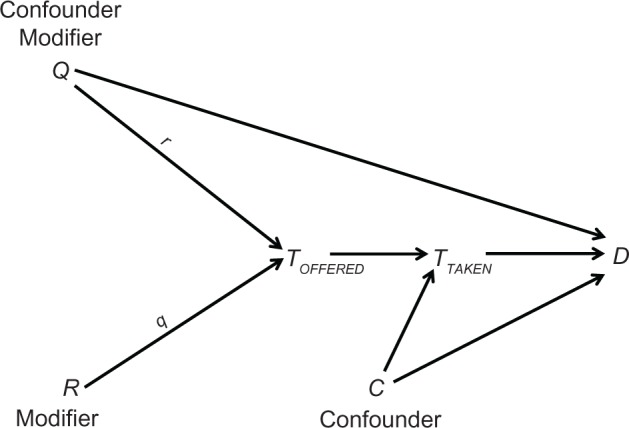
Figure 1.

A causal diagram.
Notes: TOFFERED denotes the treatment offered; TTAKEN denotes the treatment taken; D denotes the outcome; R, Q, and C are generic variables; r denotes a value of the modifier R; q denotes a value of the modifier Q.

A causal diagram.
Notes: TOFFERED denotes the treatment offered; TTAKEN denotes the treatment taken; D denotes the outcome; R, Q, and C are generic variables; r denotes a value of the modifier R; q denotes a value of the modifier Q.