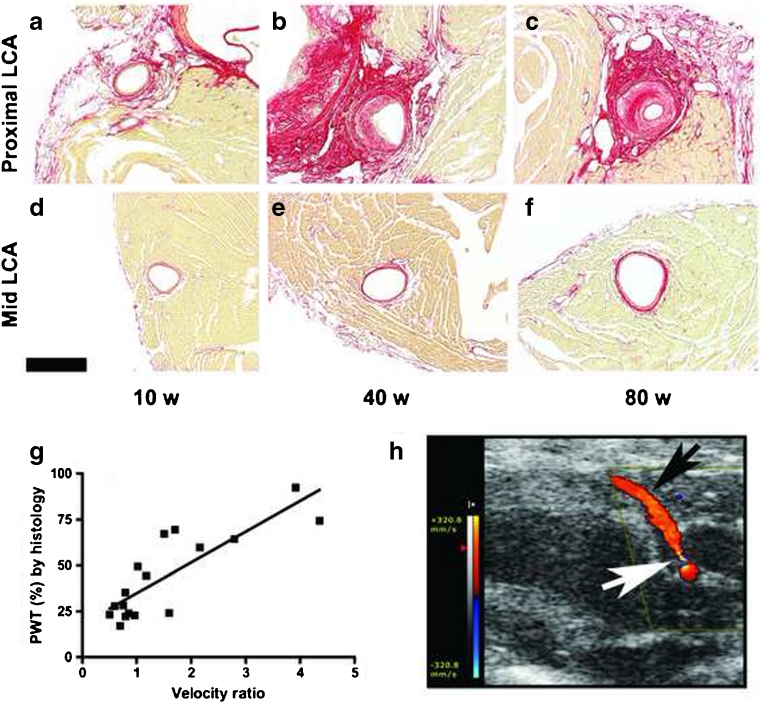
Fig. 4.
Plaque growth with increasing age in apoE/LDL double knock-out mice in the proximal (a,b,c) and mid-LCA (d,e,f) and the correlation between coronary artery percentage wall thickness as measured with histology and proximal to mid flow velocity ratio in the double knock-out mice of different age (g). Scale bar = 300 μm. A typical color Doppler image (h) showing site of proximal stenosis (white arrow) and stenosis-free segment in the more distal parts of the LCA (black arrow). Adapted from [75] with permission

