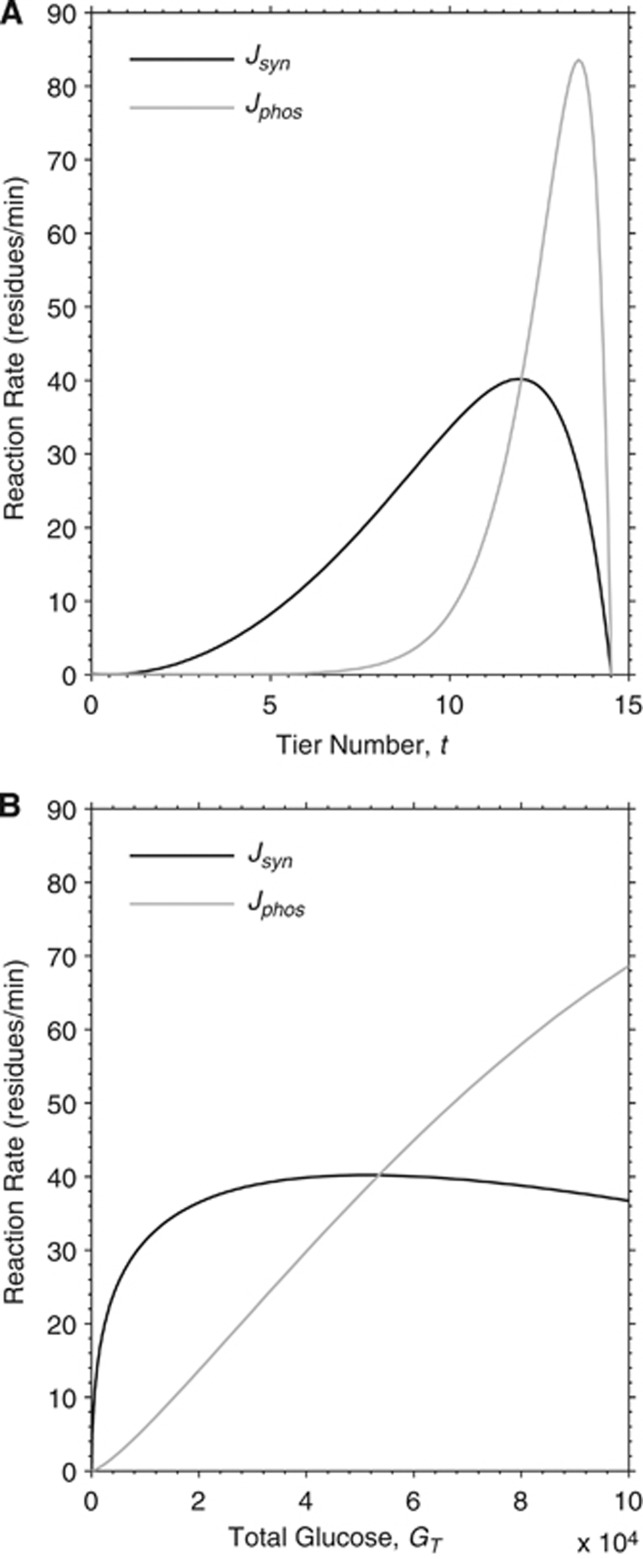
Figure 1.
Model reaction rates of glycogen synthase and phosphorylase as a function of molecule size. Theoretical dependency between the size of the molecule, here represented either as tier number t (A) or as total glucose GT (B), and synthase and phosphorylase reaction rates (expressed as residues per minute), Jsyn and Jphos, respectively. The point of intersection between the curves identifies the steady-state position of the mature glycogen particle corresponding to 12 tiers and a content of ∼53,000 glucosyl units. Specifically, the rate of synthase is higher than that of phosphorylase when the glucose content is smaller than 53,299 in our simulations, and vice versa. Note that tier number is calculated from total glycogen according to equation (2), thus the two plots are equivalent.

