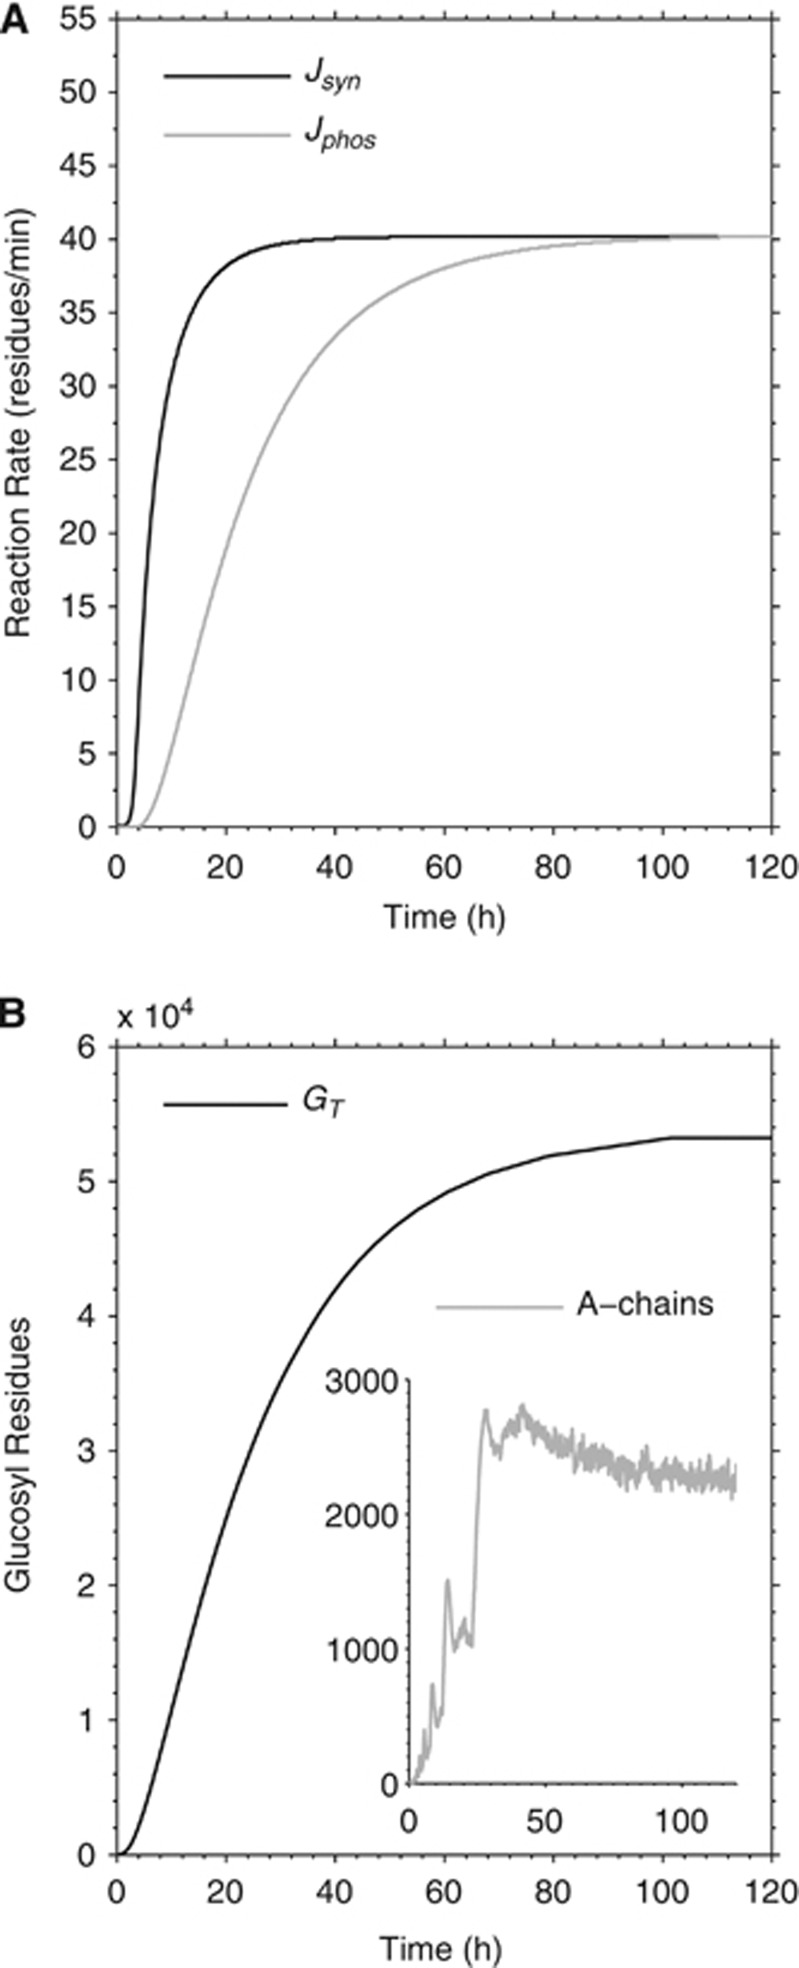
Figure 3.
Simulated growth process of an individual glycogen molecule. (A) Simulated synthase and phosphorylase reaction rates (Jsyn and Jphos, respectively) during the growth process. The molecule is not complete before about 120 hours. (B) Time course of total glucose content GT. Note that the amount of A-chains (i.e., non reducing ends) in the whole glycogen molecule fluctuates during turnover even when the steady state is established (inset in B). Note also the apparent peaks in the number of A-chains that occur during the transition from a tier to the next (i.e., creation of two new branches per chain at fifth and tenth residues). The subsequent plateau is established when the ‘mother' chains become full, or 13 residues long.

