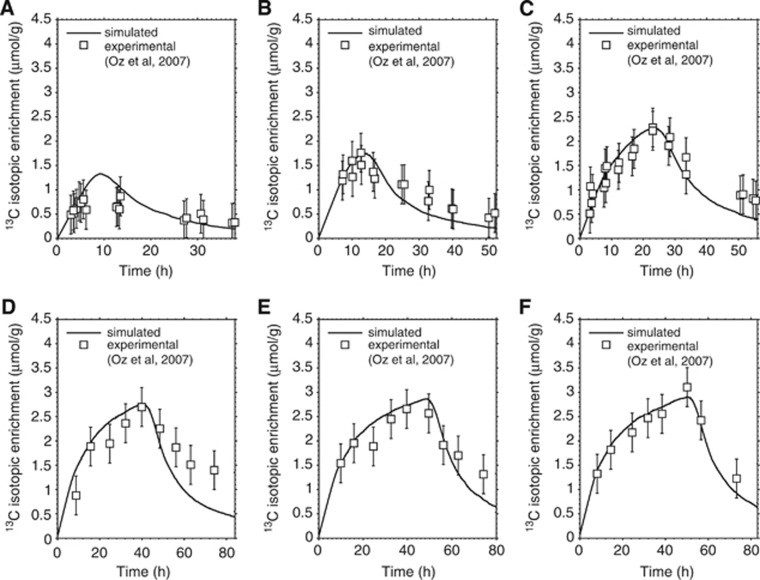
Figure 5.
Simulated and experimental time course of label incorporation in glycogen for different infusion durations. Fitting between simulated and nuclear magnetic resonance (NMR) experimental data of 13C labeled glucose content within the glycogen molecule corresponding to total infusion time of (A) 6 hours, (B) 11 hours, (C) 22 hours, (D) 40 hours, (E) 48 hours, and (F) 50 hours. The simulated curves are obtained by rescaling the label content of a single glycogen molecule to a pool of glycogen molecules and assuming a total glycogen concentration of 3.5 μmol/g. The experimental data points (open squares) represent the 13C-NMR measurements obtained in human brain by Oz et al.5 The error bar on experimental data is assumed to be fixed at 0.4 μmol/g reflecting 20% sensitivity on individual measurements (Dr Gulin Oz, personal communication). For details about the [1-13C]glucose infusion protocol and subject management, see ref. 5.

