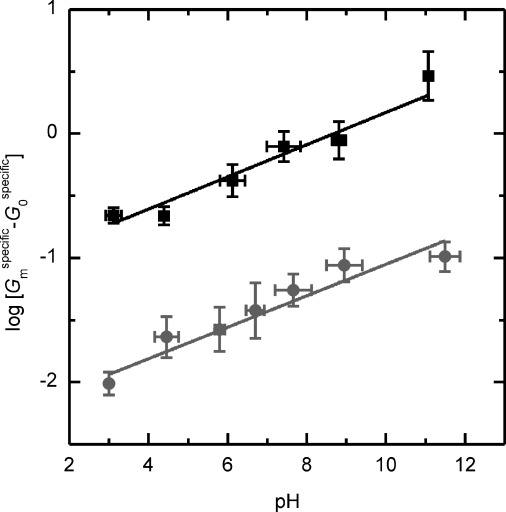
Figure 3.

Dependence of the logarithm of the specific membrane conductance on the pH of the bathing solution in the presence of 2.5 mm indole (circles) or 2.5 mm 4 F-indole (squares). The aqueous solution contained 0.1 m KCl and 15 mm PB buffer, 15 mm potasium citrate and 15 mm tris. The pH was modified by the addition of KOH or HCl. The curves through the points is drawn according to the empirical Equation (7).
