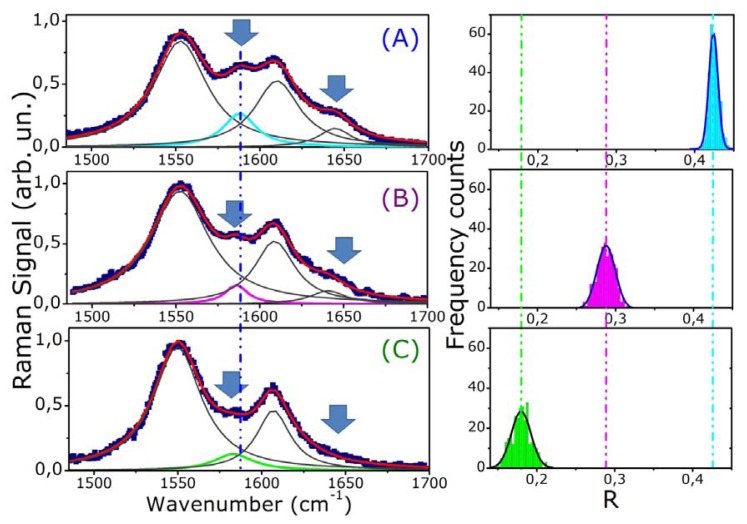
Figure 6.
Comparison between the Raman spectra and (right) statistical distributions of the ratio R of the Raman peaks ν37 to ν11of (A) healthy, (B) α-thalassemic, and (C) β-thalassemic RBC. The arrows in the left part of the Figure indicate spectral features whose intensity changes significantly and the dash-dotted line highlights the observed wavenumber shift of the spectral peaks.

