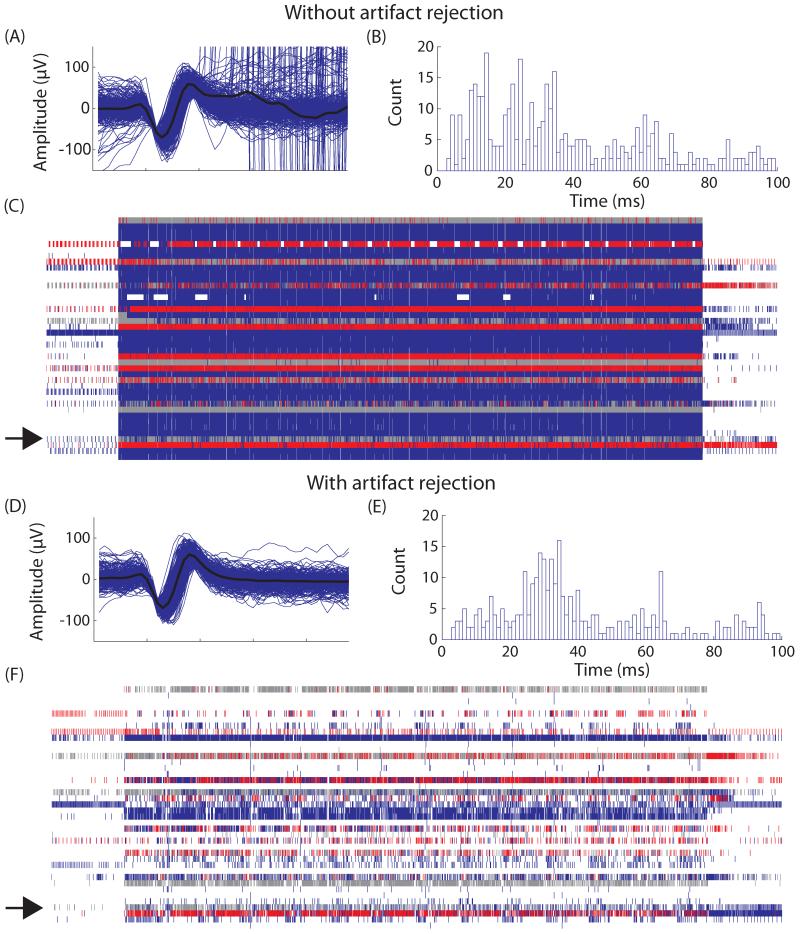
Figure 3.
Single neuron recordings without and with artifact rejection in Cat D. Without artifact rejection: A) Multiple waveforms identified as a single unit are overlaid with the average waveform shown in black. Large amplitude stimulation artifacts are also erroneously identified as the single unit. B) A histogram of interspike intervals (ISI) shows large numbers of events occurring at harmonics of the stimulation frequency (16 ms). C) A raster plot of all channels with neural data. Each channel is plotted on a separate horizontal line. Each small vertical line represents detection of an action potential on an electrode. Gray lines are unsorted units while colored lines represented signals accepted for processing. Due to stimulation artifacts so many events are accepted that it appears as a blue block. The channel of the single unit shown is A) and B) is highlighted with an arrow. D), E), and F) are similar except they show the same single unit with artifact rejection. Artifacts have been successfully removed from the waveform, ISI histogram and the raster plot and are not accepted into the prediction algorithm.

