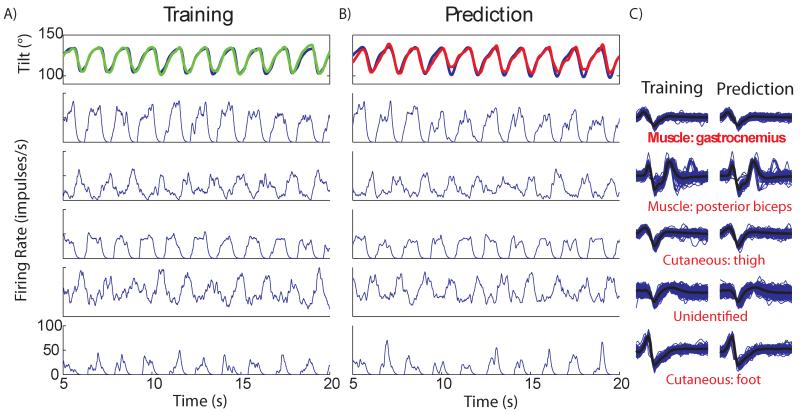
Figure 5.
The individual single units used in a prediction of limb tilt in Cat E. The training column (panel A) shows the recorded tilt during the training trial (blue) and the training fit (green). Below are the firing rates of the five most correlated units used in the prediction. The testing column (panel B) shows the recorded tilt (blue) and the real-time prediction (red) from the same trial as Figure 4. Again, firing rates for the same units are shown for the prediction trial. The waveforms during training and prediction of the selected units are shown in panel C, respectively for each unit during training and testing. Functionality of each unit is listed under the waveform and was determined during a separate identification process. From training to prediction waveforms and firing rates are stable.

