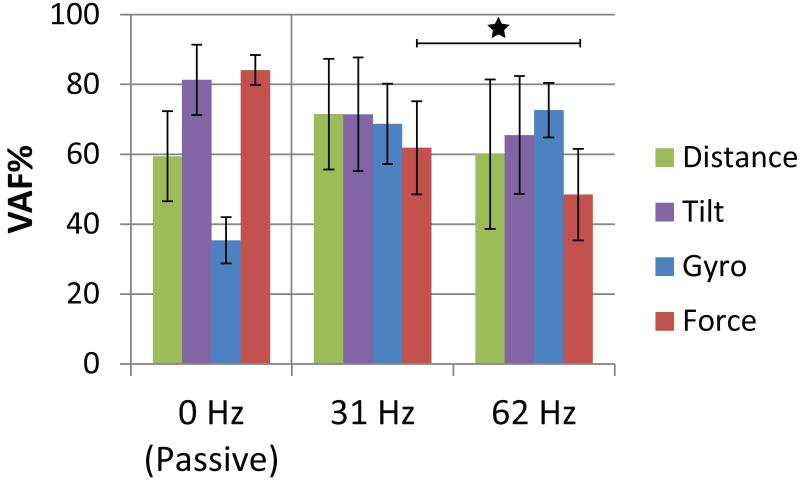
Figure 8.
The effect of stimulation frequency on prediction quality (VAF%) for each sensory signal during open loop trials. Bars represent the standard deviation of the predictions. Significant differences in mean VAF% between stimulation frequencies for each sensor are shown with a star (P<0.001). 0 Hz is passive movement of the hind limb, 31 Hz is the lower stimulation frequency tested and 62 Hz is the higher stimulation frequency. Passive distance and tilt: N=16, gyro: 7, force: 11; 31 Hz distance and tilt: N=13, gyro and force= 15; 62 Hz distance and tilt: N=47, gyro and force= 34.

