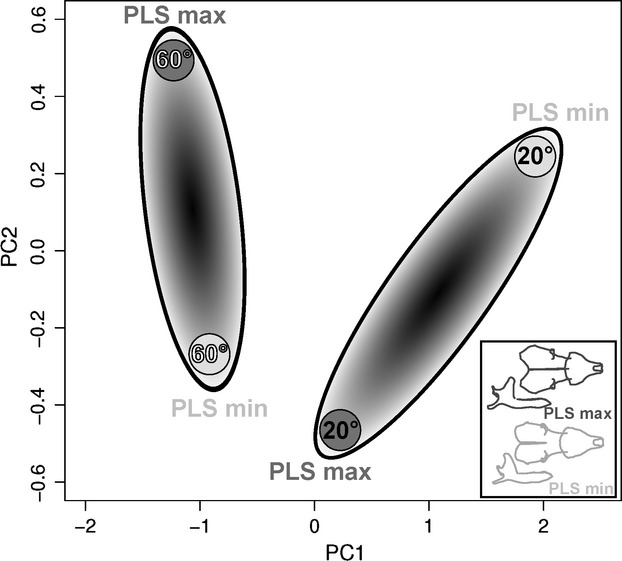
Fig. 8.

PCA performed on six functional variables. Functional variables were calculated for two different gape angles 20 º and 60 °, black and white characters, respectively. The functional data are calculated using the shapes representing the extremes of the first PLS axes, grey ovals. A graphic representation of the co-variation in shape between skull and mandible has been shown (bottom right) illustrating the consequences of variation in shape on variation in function. In dark grey, the positive part of the PLS axis, in pale grey the negative one.
