
Figure 2.
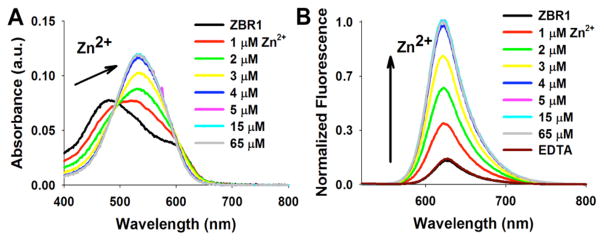
Absorption (A) and normalized fluorescence emission (B) spectra of ZBR1 at different total concentrations of Zn2+. Spectra were acquired on 5 μM solutions of ZBR1 in 100 mM KCl, 50 mM PIPES, pH 7.0 at 25 °C, after the addition of increasing amounts of total ZnCl2, followed 100 μM EDTA. λex = 525 nm.