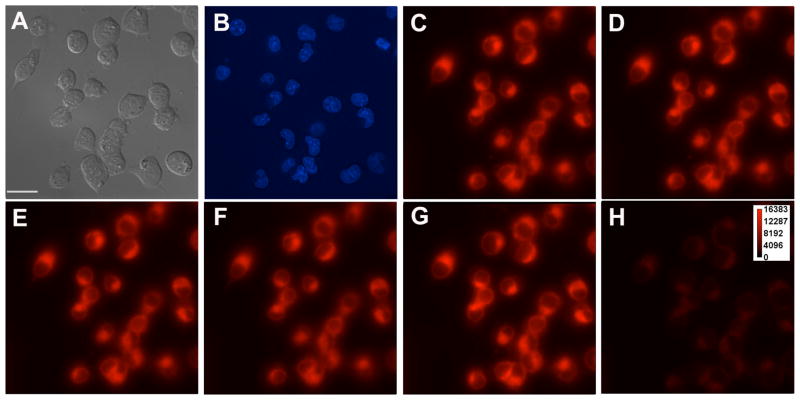
Figure 9.
Representative images of Sin-1-induced ZBR1 fluorescence change in NSCs. A) Bright-field image of NSCs. B) Nuclear staining by Hoechst 33258. C) Fluorescence image of ZBR1 before the addition of 100 μM Sin-1. D) 5 min after the addition of Sin-1. E) 10 min after the addition of Sin-1. F) 15 min after the addition of Sin-1. G) 5 min after the addition of 25 μM Zn2+/pyrithione (1:2). H) 5 min after the addition of 50 μM TPA. Scale bar =25 μm.

