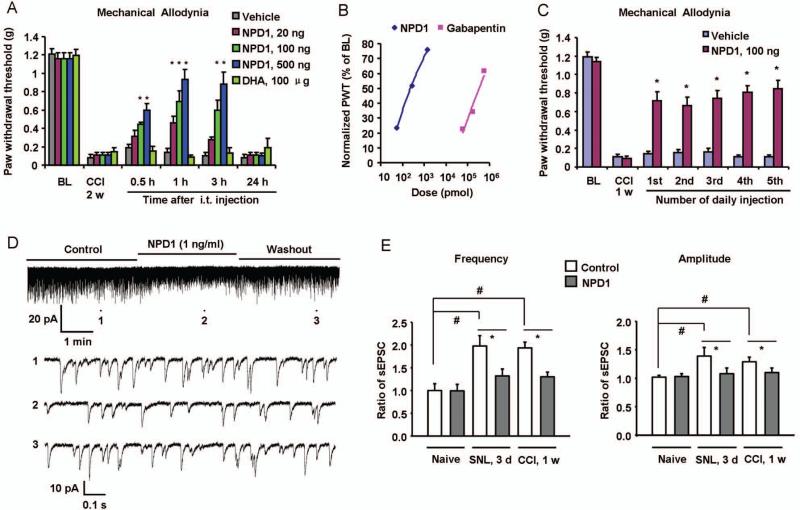
Figure 3. Spinal post-treatment of NPD1/PD1 reduces nerve injury-induced neuropathic pain and normalizes spinal cord synaptic plasticity.
(A) Intrathecal injection of NPD1/PD1 (20, 100, 500 ng), 2 weeks after nerve injury, dose-dependently reduces CCI-induced mechanical allodynia. The two-way ANOVA showed significant overall between-group differences between the vehicle and NPD1 groups, F(1,60) = 6.039, p =0.0302 for 20 ng group, F(1,60) = 16.23, p =0.0017 for 100 ng group, and F(1,60) = 42.72, p<0.0001 for 500 ng group. However, there's no significant difference between the vehicle and DHA (100 μg) group, F(1,55) = 0.1275, p =0.7278. Bonferroni post hoc tests revealed that CCI-induced mechanical allodynia was significantly reduced by NPD1 treatment in a dose-dependent manner. *P<0.05, compared to corresponding vehicle (PBS) control, n = 6~7 mice. BL, baseline before nerve injury. (B) Dose-dependent inhibition of CCI-induced mechanical allodynia by NPD1/PD1 (i.t., 20-500 ng ≈ 0.06-1.4 nmol) and gabapentin (i.t., 10-100 μg ≈ 58.4-584.1 nmol). Mechanical allodynia was tested 3 h after the drug injection. PWT, paw withdrawal threshold. Note that the effective doses of gabapentin are much higher than that of NPD1/PD1. (C) Repeated injections of NPD1/PD1 (100 ng, i.t., once a day for 5 days) produces sustained reduction of CCI-induced mechanical allodynia, tested 1 h after each injection. The two-way ANOVA showed significant difference between the NPD1 and vehicle group, F(1,60) = 81.12, p<0.0001. Post hoc tests revealed that CCI-induced mechanical allodynia was significantly reduced by each NPD1 treatment. *P<0.05, compared to corresponding vehicle (PBS) control, n = 6 mice. (D) Traces of spontaneous excitatory postsynaptic currents (sEPSCs) in lamina II neurons of spinal cord slices of CCI mice (1 week) before and after NPD1/PD1 perfusion. Trace 1, 2, and 3 (top panel) show sEPSCs before NPD1/PD1 treatment, during NPD1/PD1 treatment, and after washout, respectively. Low panels are enlargements of traces (1, 2, and 3) in the up panel. (E) sEPSC frequency and amplitude in spinal cord slices from SNL and CCI mice. Note that nerve injury-induced increases in sEPSC frequency and amplitude are normalized by NPD1. *P<0.05, #P<0.05, n=5-10 neurons. Results are mean ± SEM.

