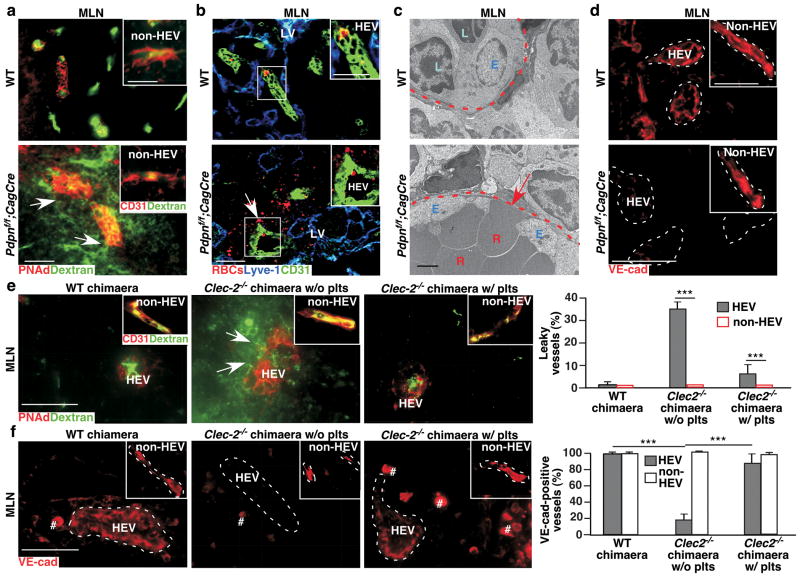
Figure 3. Interactions of FRC PDPN and platelet CLEC-2 are critical for HEV junctional integrity.
a, Confocal images of intravenously injected FITC-dextran (2,000 kDa) in P15 MLNs. Arrows indicate vascular leak of FITC-dextran. Insets show non-HEVs blood vessels. b, Confocal images of intravenously injected/fluorescently labelled RBCs (red) in MLNs from 2-month-old mice. Arrow and insets show labelled RBCs outside of HEVs (CD31+). c, Transmission electron micrographs of HEVs in MLNs. Arrow indicates gaps and RBCs between high endothelial cells. d, Confocal images of VE-cad in P8 MLNs. Insets show VE-cad staining in non-HEV blood vessels. e, Confocal analysis of intravenously injected FITC-dextran in MLNs from WT or Clec2−/− BM chimaeras with or without previous intravenous injections of WT platelets (plts). Arrows indicate vascular leak of FITC-dextran. Inset depicts non-HEV blood vessels. Graphs on the right quantify number of leaking vessels (mean ± s.d., 300 vessels per group (n = 3)). f, Immunofluorescence analysis of anti-VE-cad staining of HEVs and non-HEV blood vessels in WT BM chimaeras (WT chimaera), and Clec2−/− BM chimaeras (Clec2−/− chimaeras) without or with previous intravenous injections with WT plts. # indicates non-specific staining as also observed in negative controls. Graphs on the right quantify VE-cad staining (mean ± s.d., 300 vessels per group (n = 3)). Tissues were from 1-month-old (a-c) or 12-week post BM transplantation (e, f) mice unless otherwise specified. Dashed lines mark HEVs. Data represent at least three individual experiments. Scale bars, 2 μm (TEM), 50 μm (confocal images (inset a and b, 25 μm)). ***, P < 0.001.

