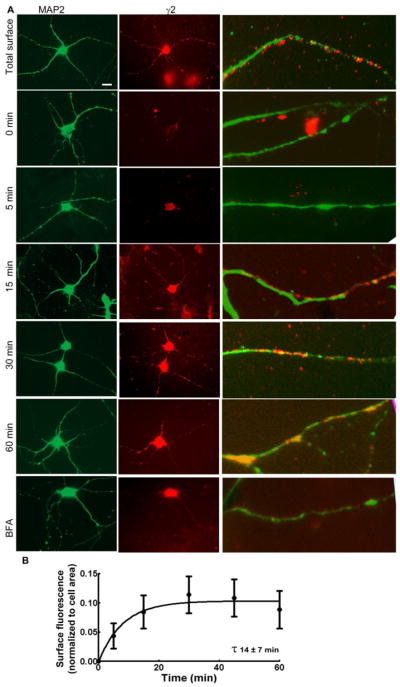
Figure 5.

The time course of the insertion of γ2-GABARs in cultured hippocampal neurons using an antibody-saturation assay. A: Representative images showing IR of newly inserted γ2-GABARs (red) over the cell soma and dendrites after 0, 5, 15, 30 and 60 min of incubation at 37°C. Total surface expression of γ2-GABARs is shown in the panel total surface. Immunoreactivity of MAP2 (green) was used to identify the dendrites. Image BFA shows immunoreactivity of newly inserted γ2-GABARs in a representative neuron incubated with brefeldin-A (5 μg/ml) for 60 min at 37°C. The white bar in the γ2 total surface panel corresponds to 10 μm. Panels on the right are magnified portions of dendrites to show newly inserted receptors. B: Surface γ2 subunit IR was normalized with the cell area and plotted as a function of time. A single-phase association equation best fit the data. n=25–30 neurons from 4–5 replicates per time point.
